Note
Go to the end to download the full example code.
3d Point clouds
Compute optimal transport between two point clouds in 3d, then compute displacement interpolation and rasterize a 2d projection of it to an image
import time
import matplotlib.pyplot as plt
import numpy as np
import scipy.sparse
import MultiScaleOT

# functions to sample from sphere and torus with constant density

def sampleSphere(n):
    phi=2*np.pi*np.random.random(size=n)
    rad=(np.random.random(size=n))**(1/3)
    cosTheta=1-2*np.random.random(size=n)
    sinTheta=(1-cosTheta**2)**0.5

    pos=np.zeros((n,3),dtype=np.double)
    pos[:,0]=rad*sinTheta*np.cos(phi)
    pos[:,1]=rad*sinTheta*np.sin(phi)
    pos[:,2]=rad*cosTheta
    return pos

def sampleTorus(n,smallRad=0.2):
    phi=2*np.pi*np.random.random(size=n)
    rad=(np.random.random(size=n))**(1/2)
    theta=2*np.pi*np.random.random(size=n)

    pos=np.zeros((n,3),dtype=np.double)
    pos[:,0]=np.cos(phi)
    pos[:,1]=np.sin(phi)
    pos[:,:2]+=smallRad*np.einsum(pos[:,:2],[0,1],np.cos(theta)*rad,[0],[0,1])
    pos[:,2]=smallRad*np.sin(theta)*rad
    return pos
hierarchyDepth=6
n=10000
nLayers=hierarchyDepth+1
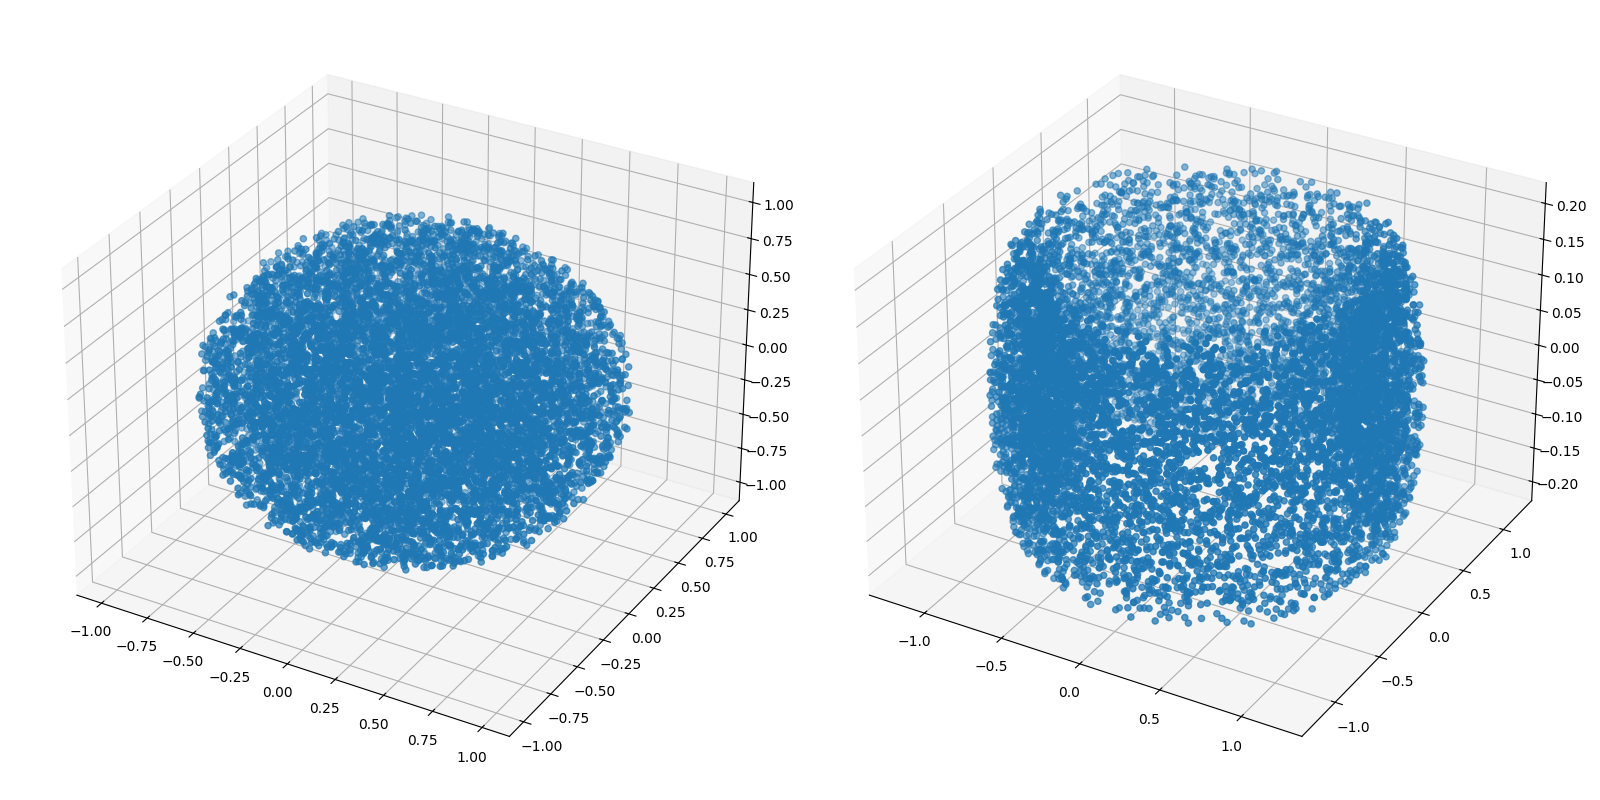
# create two point clouds: one sphere, one torus
pos1=sampleSphere(n)
pos2=sampleTorus(n)
mu1=np.full(n,1/n,dtype=np.double)
mu2=np.full(n,1/n,dtype=np.double)
fig = plt.figure(figsize=(16,8))
ax = fig.add_subplot(1,2,1, projection='3d')
ax.scatter(pos1[:,0],pos1[:,1],pos1[:,2])
ax = fig.add_subplot(1,2,2, projection='3d')
ax.scatter(pos2[:,0],pos2[:,1],pos2[:,2])
plt.tight_layout()
plt.show()
Setup multi-scale solver
# generate multi-scale representations
MultiScaleSetup1=MultiScaleOT.TMultiScaleSetup(pos1,mu1,hierarchyDepth,childMode=0)
MultiScaleSetup2=MultiScaleOT.TMultiScaleSetup(pos2,mu2,hierarchyDepth,childMode=0)
# generate a cost function object
costFunction=MultiScaleOT.THierarchicalCostFunctionProvider_SquaredEuclidean(
        MultiScaleSetup1,MultiScaleSetup2)
# eps scaling
epsScalingHandler=MultiScaleOT.TEpsScalingHandler()
epsScalingHandler.setupGeometricMultiLayerB(nLayers,.3E-3,4.,2,2)

# error goal
errorGoal=1E-3
# sinkhorn solver object
SinkhornSolver=MultiScaleOT.TSinkhornSolverStandard(epsScalingHandler,
        0,hierarchyDepth,errorGoal,
        MultiScaleSetup1,MultiScaleSetup2,costFunction
        )
test if multi-scale setup has appropriate numbers of elements in each layer
print([MultiScaleSetup1.getNPoints(i) for i in range(nLayers)])
print([MultiScaleSetup2.getNPoints(i) for i in range(nLayers)])
[1, 8, 64, 389, 2419, 7696, 10000]
[1, 8, 55, 354, 1907, 6886, 10000]
Solve
t1=time.time()
SinkhornSolver.initialize()
print(SinkhornSolver.solve())
t2=time.time()
print("solving time: ",t2-t1)
0
solving time:  18.89093589782715
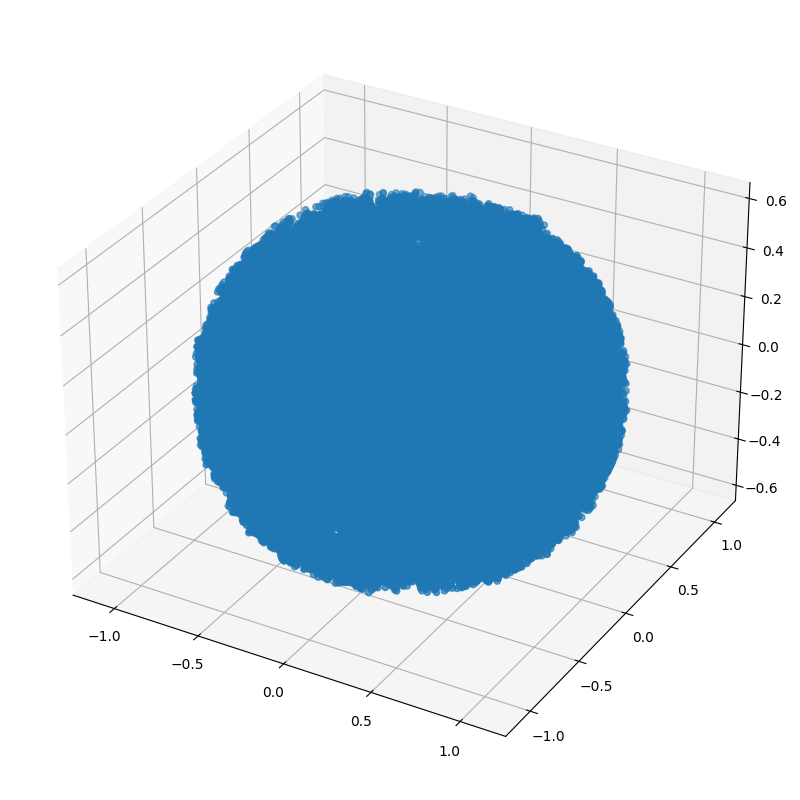
compute displacement interpolation (for more explanation on this part, see also the corresponding examples)
couplingData=SinkhornSolver.getKernelPosData()

t=0.5
interpData=MultiScaleOT.interpolateEuclidean(couplingData,pos1,pos2,t)
# interpData is a container of particle masses and coordinates
# these can be extracted via interpData.getDataTuple()
muT,posT=interpData.getDataTuple()

fig = plt.figure(figsize=(8,8))
ax = fig.add_subplot(1,1,1, projection='3d')
ax.scatter(posT[:,0],posT[:,1],posT[:,2])

plt.tight_layout()
plt.show()
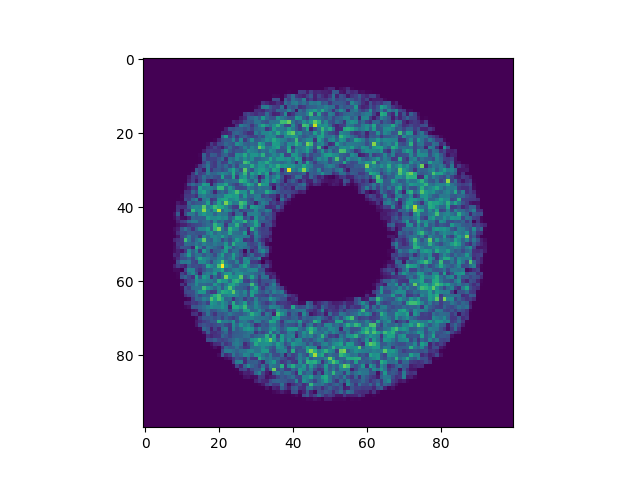
rasterize x and y coords of the interpolation
nPx=100
scale=1.3
reImg=np.zeros((nPx,nPx),dtype=np.double)
# recompute displacement interpolation with scaled coords, drop z coord
pos1s=0.5*nPx*(1+pos1[:,:2]/scale)
pos2s=0.5*nPx*(1+pos2[:,:2]/scale)
t=0.5
interpData=MultiScaleOT.interpolateEuclidean(couplingData,pos1s,pos2s,t)

MultiScaleOT.projectInterpolation(interpData,reImg)
# show rasterization
plt.imshow(reImg)
plt.show()
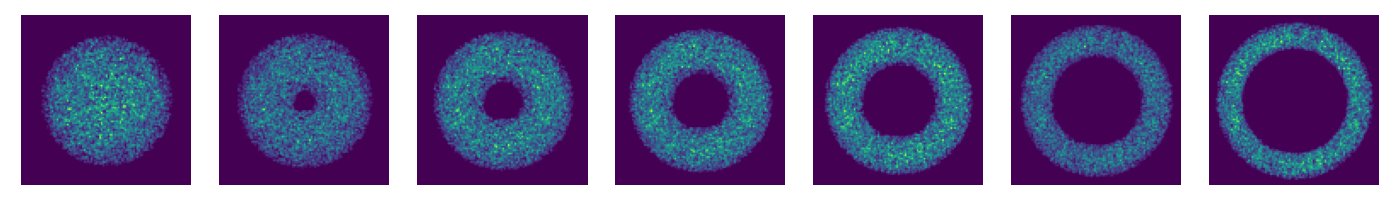
now do this for a whole sequence of times
nT=7
tList=np.linspace(0.,1.,num=nT)
fig=plt.figure(figsize=(nT*2,2))
for i,t in enumerate(tList):
    fig.add_subplot(1,nT,i+1)

    # create displacement interpolations and rasterize them to image
    interpData=MultiScaleOT.interpolateEuclidean(couplingData,pos1s,pos2s,t)
    reImg=np.zeros((nPx,nPx),dtype=np.double)
    MultiScaleOT.projectInterpolation(interpData,reImg)

    plt.imshow(reImg)
    plt.axis("off")
plt.tight_layout()
plt.show()
Total running time of the script: (0 minutes 21.530 seconds)