Note
Go to the end to download the full example code.
2d Image Interpolation
This example computes the optimal transport between two simple 2-dimensional images and then generates a simple approximation of the displacement interpolation
import time
import matplotlib.pyplot as plt
import numpy as np
import scipy.sparse
import MultiScaleOT
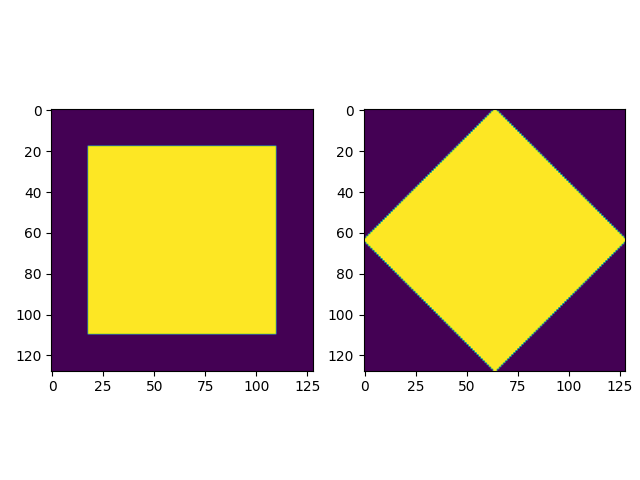
# Create two images: a square and one rotated by 45deg
# with approximately equal areas
hierarchyDepth=7 # feel free to play with this value, up to 7 (i.e. 128x128 images) it should be quite low-weight
n=2**hierarchyDepth
nLayers=hierarchyDepth+1
# Square
img1=np.zeros((n,n),dtype=np.double)
thresh=int(n*0.5*(1.-1./np.sqrt(2)))
img1[thresh:-thresh,thresh:-thresh]=1.
img1=img1/np.sum(img1)
# Diamond
img2=np.abs(np.arange(n).reshape((-1,1))-n/2+0.5)+np.abs(np.arange(n).reshape((1,-1))-n/2+0.5)
img2[...]=(img2<n/2+0.1)
img2=img2/np.sum(img2)
# Simple visualization
fig=plt.figure()
fig.add_subplot(1,2,1)
plt.imshow(img1)
fig.add_subplot(1,2,2)
plt.imshow(img2)
plt.tight_layout()
plt.show()
Aux function for extracting weighted point clouds from images
def extractMeasureFromImage(img,zeroThresh=1E-14):
    dim=img.shape

    pos=np.zeros(dim+(2,),dtype=np.double)
    pos[:,:,0]=np.arange(dim[0]).reshape((-1,1))
    pos[:,:,1]=np.arange(dim[1]).reshape((1,-1))
    pos=pos.reshape((-1,2))
    keep=(img.ravel()>zeroThresh)
    mu=img.ravel()[keep]
    pos=pos[keep]
    return (mu,pos)

# extract measures from images
mu1,pos1=extractMeasureFromImage(img1)
mu2,pos2=extractMeasureFromImage(img2)
Setup multi-scale solver
# generate multi-scale representations
MultiScaleSetup1=MultiScaleOT.TMultiScaleSetup(pos1,mu1,hierarchyDepth,childMode=0)
MultiScaleSetup2=MultiScaleOT.TMultiScaleSetup(pos2,mu2,hierarchyDepth,childMode=0)
# generate a cost function object
costFunction=MultiScaleOT.THierarchicalCostFunctionProvider_SquaredEuclidean(
        MultiScaleSetup1,MultiScaleSetup2)
# eps scaling
epsScalingHandler=MultiScaleOT.TEpsScalingHandler()
epsScalingHandler.setupGeometricMultiLayerB(nLayers,1.,4.,2,2)

# error goal
errorGoal=1E-3
# sinkhorn solver object
SinkhornSolver=MultiScaleOT.TSinkhornSolverStandard(epsScalingHandler,
        0,hierarchyDepth,errorGoal,
        MultiScaleSetup1,MultiScaleSetup2,costFunction
        )
Solve
t1=time.time()
SinkhornSolver.initialize()
print(SinkhornSolver.solve())
t2=time.time()
print("solving time: ",t2-t1)
0
solving time:  7.584433555603027
Extract coupling data in a suitable sparse data structure
couplingData=SinkhornSolver.getKernelPosData()
# couplingData is a container for the coupling data in scipy.sparse.coo_matrix format
# by calling the method couplingData.getDataTuple() one could obtain the list of
# non-zero values and their row and column indices

# we plug this into a simple routine for approximating the displacement interpolation at some time t
t=0.5
interpData=MultiScaleOT.interpolateEuclidean(couplingData,pos1,pos2,t)
# interpData is a container of particle masses and coordinates
# these can be extracted via interpData.getDataTuple()
muT,posT=interpData.getDataTuple()
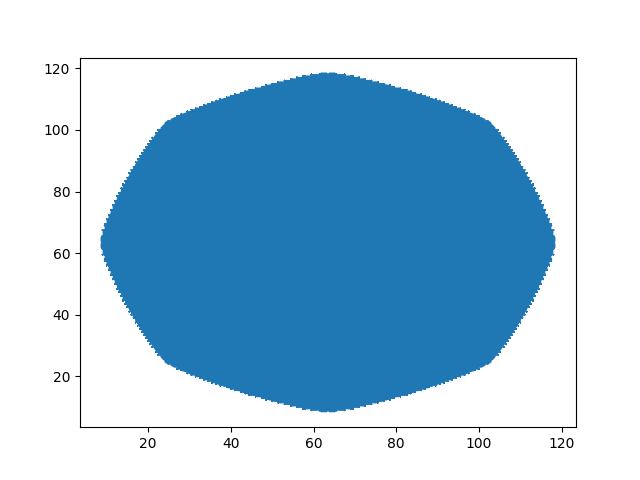
the intermediate measure can in principle be visualized as a weighted point cloud this can be slow on large images and also may not give a very good visual impression of the measure
plt.scatter(posT[:,0],posT[:,1],s=10*muT/np.max(muT))
plt.show()
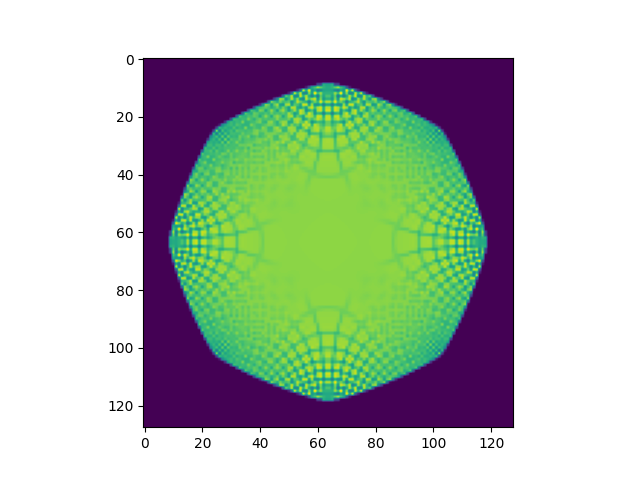
alternatively, the point cloud can be rasterized to an image of suitable dimensions particle coordinates are assumed to be pixels (one pixel has length 1, origin at (0,0)) one may need to rescale coordinates appropriately before calling the function and one has to provide a suitable target image the target image is allocated:
reImg=np.zeros((n,n),dtype=np.double)
# rasterize
MultiScaleOT.projectInterpolation(interpData,reImg)
# show rasterization
plt.imshow(reImg)
plt.show()
now do this for a whole sequence of times
nT=10
tList=np.linspace(0.,1.,num=nT)
fig=plt.figure(figsize=(nT*2,2))
for i,t in enumerate(tList):
    fig.add_subplot(1,nT,i+1)

    # create displacement interpolations and rasterize them to image
    interpData=MultiScaleOT.interpolateEuclidean(couplingData,pos1,pos2,t)
    reImg=np.zeros((n,n),dtype=np.double)
    MultiScaleOT.projectInterpolation(interpData,reImg)

    plt.imshow(reImg)
    plt.axis("off")
plt.tight_layout()
plt.show()

Total running time of the script: (0 minutes 11.849 seconds)